
The aspirants who are preparing for SSC CGL must understand what SSC CGL is.
The SSC CGL age limit and syllabus for SSC CGL has been already mentioned on their website https://ssc.nic.in/
Collection Classification and Presentation of Statistical Data for SSC-CGL
In statistics, the raw data is collected and classified on the basis of different categorizations to simplify the further process.
Collection of Statistical Data: Data can be collected in three ways:
Classification of Statistical Data:
Classification of statistical data includes the process of aligning data into a particular order on the basis of some common characteristic from the available raw data.
1. Qualitative Classification
2. Quantitative Classification
3. Chronological Classification
4. Geographical Classification
5. Conditional Classification
Representation of data:
Textural Method: This method is used on data for synthesis and generalization purposes.
Tabular Method: It represents the data in row and column-wise and provides a way to compare it easily.
Semi tabular Method: It includes both text and tables in its representation.
Graphical Representation: It represents the data in the form of different charts or graphs like a pie chart, bar graph, etc.
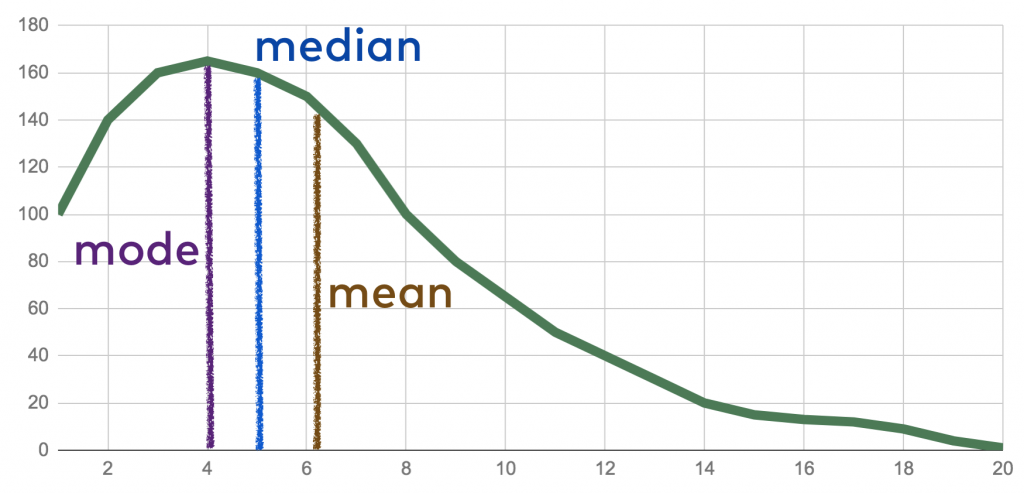
Measures of Central Tendency for SSC CGL
It is a single representation of a mass set of data.
There are three main measures of central tendency.
These measures are mean, median, mode.
Mean: It gives a single value for a mass set of data by adding all observations present in the dataset and divide it by the total number of values in the dataset. Here scope for estimation is not present.
Mean - addition of all observations/ total number of observations
Median - It gives the middle value of an arranged dataset where an arrangement of the values is in ascending order.
When a dataset has an odd number of observations:
Median = Middle value of dataset
When the dataset has an even number of observations:
Median= Mean of two middle values
It divides the distribution of the dataset in half.
Mode: It is the value defined on the basis of the occurrence of any value in the dataset. It gives the value of the most observed data element in the dataset.
It can be determined for both quantitative and categorical types of data.
It cannot represent the center of distribution for a dataset.
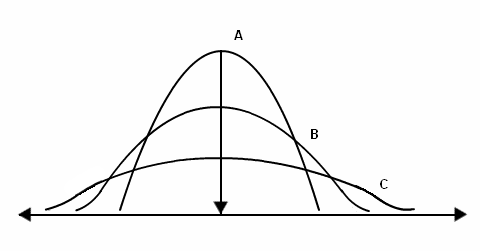
Measures of Dispersion for CGL
It represents the scattering of data. It shows the deviation of data from the central distribution.
It is used to compare different data sets and series.
Different measures of dispersion are as follows:
Range
Quartile Deviation
Interquartile range
Mean Deviation
Standard Deviation
Lorenz Curve
There are two categories of measure of dispersion.
These are as follows:
The absolute measure of dispersion: It is measured in terms of actual values of datasets.
For example,
Range= Dmax- Dmin
Where D is the distance between two values.
A relative measure of dispersion: It is used for comparing the two or more data set of different units. It is represented in the form of the ratio of averages.
Hope you find our article for your SSC-CGL Preparation!


Picky Eaters: Picky eaters are children who have strong preferences or aversions towards certain foods. They may exhibit selective eating habits,
155 followers

Online course industry is thriving as a market of infinite growth potential. If you have decided to become a part of this growing success and launch y

1253 followers

The Indian Muslim league and congress leader Jairam Ramesh has filed a petition against CAA in the Supreme Court. SSC CGL will consider this one of it
SSC Preparation Strategies & S
1551 followers

Do you want to join the Indian Air force as a pilot? Being a pilot is not an easy job. This profile is full of challenges that requires a good amoun

22 followers

Reading up current affairs for UPSC exam? The UPSC news-based portion tests the abilities of a student to correlate the daily news with government pol

1012 followers

The Jallianwala bagh massacre is one of the most inhuman incidents that took place in Indian history. This event depicts the most tragic and dark side
1012 followers
भारत के कड़े विरोध के बावजूद इस नए नक्शे में नेपाल ने तीन भारतीय इलाकों लिपुलेख, कालापानी और लिंपियाधुरा को अपने क्षेत्र के रूप में दर्शाया है भारत

13 followers

The total number of coronavirus cases are increasing day by day. Coronavirus has infected more than 1,65,799 cases in India. After the increase in Cor
22 followers


 Copy Link